Interpreting Blood Tests for Insulin Resistance: Guidelines
Insulin resistance can develop silently, making early detection through blood tests essential. Here’s what you need to know:
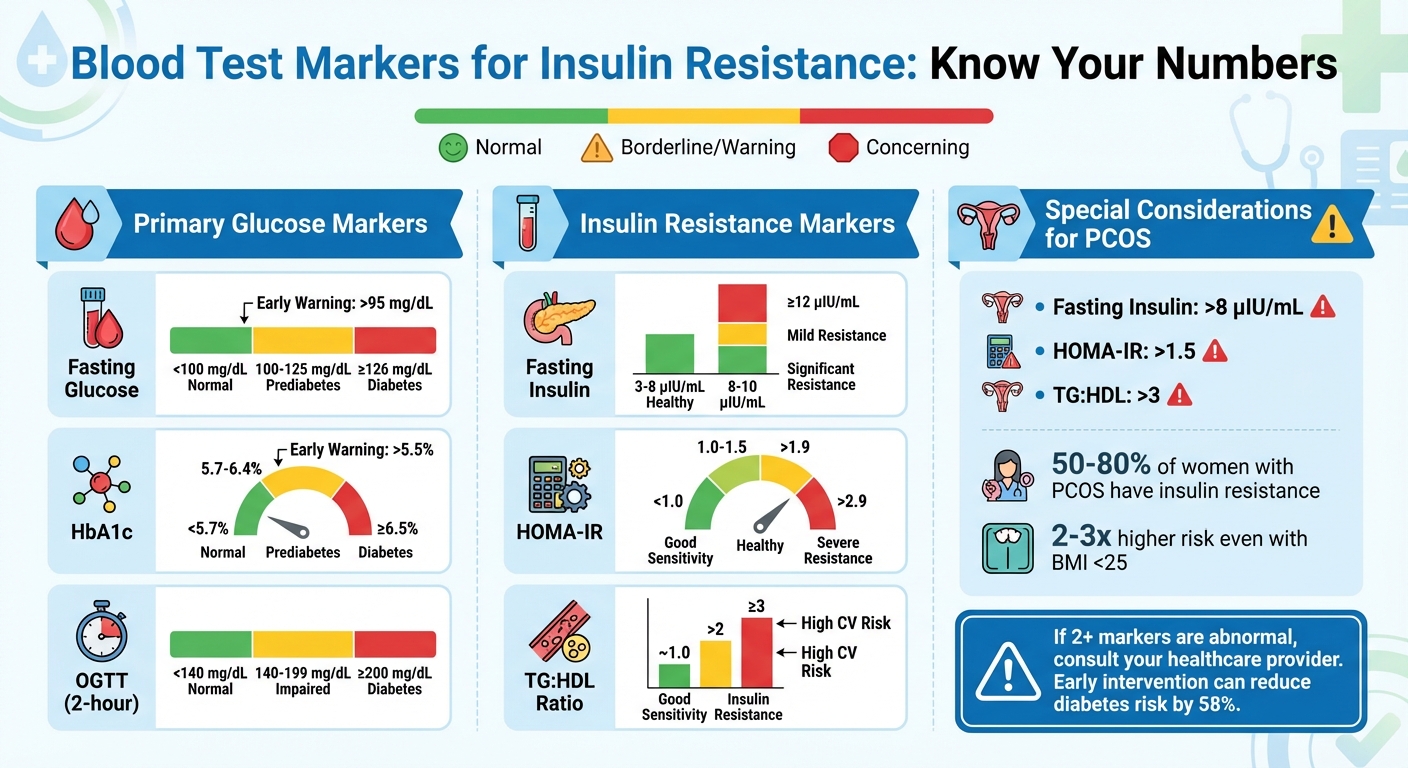
- Key markers to monitor: Fasting glucose, HbA1c, fasting insulin, HOMA-IR, and lipid profiles (e.g., triglyceride-to-HDL ratio).
- Warning signs: Normal glucose levels may mask elevated insulin levels - an early sign of insulin resistance.
- PCOS connection: Women with PCOS often show insulin resistance even with normal BMI or glucose levels.
- Diagnostic thresholds: Fasting insulin >8 μIU/mL, HOMA-IR >1.9, and TG:HDL ratio >2 suggest insulin resistance.
- Testing options: Fasting glucose, HbA1c, and OGTT provide insights, but combining markers offers a clearer picture.
Actionable tip: If your blood tests show two or more abnormal markers, consult a healthcare provider to explore lifestyle changes or treatments like metformin. Early intervention can reduce diabetes risk by 58%.
Blood Test Markers for Insulin Resistance: Normal vs Warning Ranges
Key Blood Tests and Their Interpretation
Fasting Glucose and HbA1c
Fasting plasma glucose (FPG) measures blood sugar levels after fasting for 8–12 hours, making it one of the simplest ways to screen for insulin resistance. In the U.S., a fasting glucose level under 100 mg/dL is considered normal. A reading between 100–125 mg/dL signals prediabetes, while levels at or above 126 mg/dL (confirmed on two separate occasions) indicate diabetes. Even levels above 95 mg/dL can hint at early insulin resistance.
Hemoglobin A1c (HbA1c) offers a longer-term perspective by measuring average blood sugar levels over the past three months. A normal HbA1c is below 5.7%, with values ranging from 5.7% to 6.4% pointing to prediabetes, and 6.5% or higher confirming diabetes. Since HbA1c reflects chronic glucose levels, it can reveal ongoing hyperglycemia that fasting glucose might miss. For example, an HbA1c above 6.0% coupled with elevated fasting glucose often indicates more advanced insulin resistance. Some experts even view HbA1c levels above 5.5% as an early warning sign of metabolic concerns.
These two markers together provide a clearer picture of how the pancreas is managing insulin resistance. For instance, a normal fasting glucose paired with a rising HbA1c may suggest compensatory hyperinsulinemia - where the body produces extra insulin to maintain blood sugar levels. To dig deeper, the Oral Glucose Tolerance Test (OGTT) can help assess how the body handles a glucose challenge.
Oral Glucose Tolerance Test (OGTT)
The OGTT involves fasting for 8–12 hours, followed by drinking a 75-gram glucose solution. Blood is then drawn at intervals - 0, 30, 60, 90, and 120 minutes - to evaluate how the body processes the glucose load. For the 2-hour reading, values below 140 mg/dL are normal, 140–199 mg/dL indicate impaired glucose tolerance (prediabetes), and 200 mg/dL or higher confirms diabetes.
This test is especially helpful for detecting insulin resistance in women with PCOS, who may show normal fasting glucose levels but experience significant spikes after meals. For example, a woman with PCOS might have a fasting glucose of 95 mg/dL but a 2-hour OGTT value of 160 mg/dL, signaling early insulin resistance that could benefit from lifestyle changes. Some clinics also measure insulin levels during the OGTT to detect hyperinsulinemia - an early sign of metabolic dysfunction that can appear years before glucose levels rise. These dynamic measurements provide a more detailed look at insulin sensitivity.
Fasting Insulin and HOMA-IR
Fasting insulin levels reveal how much effort the pancreas is putting into maintaining normal blood sugar levels. A healthy range is typically 3–8 μIU/mL. Levels above 8–10 μIU/mL suggest mild insulin resistance, while readings of 12 μIU/mL or higher may indicate more serious metabolic issues. For example, a fasting insulin level of 15 μIU/mL with normal glucose suggests metabolic strain, which might call for interventions like metformin or lifestyle changes.
The Homeostatic Model Assessment of Insulin Resistance (HOMA-IR) combines fasting insulin and glucose to estimate insulin resistance. The formula is:
(Fasting Insulin in μIU/mL × Fasting Glucose in mmol/L) ÷ 22.5.
A HOMA-IR below 1.0 indicates good insulin sensitivity, 1.0–1.5 is healthy, above 1.9–2.0 signals significant resistance, and levels above 2.9 point to severe resistance. For instance, if fasting insulin is 10 μIU/mL and glucose is 100 mg/dL (about 5.6 mmol/L), the HOMA-IR would be approximately 2.5, indicating insulin resistance. HOMA-IR is often compared to the euglycemic clamp - a research gold standard - and is a practical tool for clinical use.
To get a fuller picture of metabolic health, clinicians often pair fasting insulin and HOMA-IR with lipid markers like the triglyceride-to-HDL ratio. Studies show that fasting insulin combined with triglyceride levels can predict insulin resistance more effectively - with a sensitivity of 0.64 and specificity of 0.82 - than HOMA-IR alone. For example, when fasting insulin exceeds 8–10 μIU/mL, HOMA-IR is above 2.0, and the triglyceride-to-HDL ratio is above 2–3, the likelihood of insulin resistance becomes much stronger. These combined markers help guide treatment and personalize interventions.
Standardized Guidelines and Research-Based Thresholds
Diagnostic Criteria for Prediabetes and Diabetes
Standardized guidelines simplify the process of diagnosing metabolic conditions by offering clear thresholds. The American Diabetes Association (ADA) outlines specific criteria for fasting plasma glucose (FPG), the 2-hour oral glucose tolerance test (OGTT), and HbA1c to define normal, prediabetic, and diabetic ranges. These thresholds guide healthcare providers in diagnosing and managing metabolic diseases across the U.S.
Among these tests, FPG and HbA1c are often the go-to options due to their convenience and affordability. The OGTT, on the other hand, is typically reserved for cases where results are borderline or when there’s a strong suspicion of insulin resistance. Such cases include women with polycystic ovary syndrome (PCOS), individuals with a family history of diabetes, or those with a history of gestational diabetes. When test results fall into the prediabetic range, it’s a clear indicator that insulin resistance is already impacting glucose control, prompting further evaluation and early intervention.
Research-Validated Insulin Resistance Markers
While ADA guidelines focus primarily on glucose levels, other markers such as fasting insulin and HOMA-IR provide valuable insights into insulin resistance before glucose levels begin to rise. Research confirms that fasting insulin and HOMA-IR closely align with the hyperinsulinemic-euglycemic clamp, considered the gold standard for assessing insulin sensitivity. Fasting insulin levels above 10–12 μIU/mL and HOMA-IR values over 1.9 are strong indicators of insulin resistance. A HOMA-IR below 1.0 suggests normal insulin sensitivity, while values between 1.0–1.5 are considered healthy. Readings exceeding 2.9–3.0 point to severe resistance.
Lipid markers also provide valuable clues. Research shows that combining fasting insulin with fasting triglycerides offers better predictive accuracy for insulin resistance compared to insulin or HOMA-IR alone. A TG:HDL ratio close to 1.0 reflects good insulin sensitivity, while ratios above 2 suggest insulin resistance, with values of 3 or more linked to increased cardiovascular risk. For women with PCOS, elevated fasting insulin, HOMA-IR, and TG:HDL ratios often signal insulin resistance, even when BMI and fasting glucose levels appear normal. Clinicians frequently treat HOMA-IR above 2 or fasting insulin above 8–10 μIU/mL as significant markers in PCOS, prompting early interventions such as lifestyle changes, metformin, or other insulin-sensitizing therapies. Telehealth platforms like Oana Health (https://oanahealth.com) incorporate these markers into tailored treatment plans for women across the U.S., addressing symptoms like weight gain, acne, and hormonal imbalances.
Combining Multiple Markers
Using multiple markers together can improve diagnostic precision. Clinicians often combine results from various tests to get a clearer picture of insulin resistance severity. For instance, a patient with a fasting glucose level of 98 mg/dL (just below the prediabetes threshold) might also have a fasting insulin of 15 μIU/mL, a HOMA-IR of 3.2, and a TG:HDL ratio of 3.5. Taken together, these results point to significant insulin resistance that requires immediate attention.
Commercial panels like the Quest Diagnostics CardioIQ Insulin Resistance Panel with Score integrate markers such as insulin and C-peptide into a single score. These panels are especially useful for tracking progress over time and helping patients better understand their risks. While this integrated approach is highly effective, it also presents challenges that need further investigation.
Special Considerations for Women with PCOS
PCOS and Insulin Resistance
Women with PCOS often face unique struggles with insulin resistance, with studies showing that 50% to 80% of women with PCOS are affected. Even women with a BMI under 25 kg/m² - considered lean - are 2 to 3 times more likely to experience insulin resistance compared to those without PCOS. This happens because factors like hyperandrogenism, ovarian dysfunction, and genetics impair how cells respond to insulin, making resistance an issue even without excess body fat.
These physiological differences also mean standard blood test interpretations might not tell the whole story. For example, a fasting glucose level of 95 mg/dL may seem normal, but for a woman with PCOS, it could still signify insulin resistance. Experts recommend stricter benchmarks for PCOS, such as fasting insulin levels above 8 μIU/mL and a HOMA-IR (Homeostatic Model Assessment of Insulin Resistance) score over 1.5. Additionally, an elevated triglyceride-to-HDL (TG:HDL) ratio - values over 3 - can indicate insulin resistance and a higher risk of cardiovascular issues.
The oral glucose tolerance test (OGTT) can reveal another key pattern in PCOS. Women with PCOS often show 2-hour insulin levels exceeding 100 μIU/mL, highlighting prolonged compensatory hyperinsulinemia. This state can last for years before blood glucose levels rise, which is why relying solely on glucose or HbA1c tests can overlook up to 40% to 50% of insulin resistance cases in these women. Regular tracking of these markers is essential for early detection and effective treatment.
Monitoring Treatment Progress
Given the diagnostic challenges in PCOS, monitoring blood markers over time is key to evaluating treatment success. For women using metformin (typically dosed between 1,500 and 2,000 mg daily), improvements are often seen within six months, with HOMA-IR dropping by around 25% and fasting insulin levels decreasing by 20% to 40%. GLP-1 agonists, such as semaglutide, can reduce insulin levels and the TG:HDL ratio by about 25% over a year, while lifestyle changes can lower HOMA-IR by 10% to 20%.
Frequent retesting, typically every 3 to 6 months, allows clinicians to assess progress. The goal is often to bring HOMA-IR below 1.5 and fasting insulin under 8 μIU/mL. For example, a 28-year-old woman with PCOS and a BMI of 24 started treatment with a fasting glucose level of 95 mg/dL, an insulin level of 14 μIU/mL, and a HOMA-IR of 3.2. After six months on metformin and dietary adjustments, her retest showed a fasting glucose of 88 mg/dL, an insulin level of 7 μIU/mL, and a HOMA-IR of 1.2 - a 60% improvement in insulin sensitivity.
Telehealth platforms like Oana Health are helping women across the U.S. by incorporating these specific markers into personalized treatment plans. These plans address insulin resistance while also targeting symptoms like irregular periods, acne, and unwanted hair growth.
sbb-itb-6dba428
Challenges and Limitations of Blood Test Interpretation
Variability in Test Results
Interpreting blood tests for insulin resistance comes with its fair share of hurdles. One major issue is the variability in how different labs conduct these tests. For instance, some labs use specific techniques like the Coat-A-Count method to measure insulin levels, but these methods can yield inconsistent fasting insulin results.
Biological factors add another layer of complexity. Even small differences in fasting duration can significantly influence glucose and insulin readings. The commonly used HOMA-IR formula assumes standard baseline values, but these assumptions don't always hold true for everyone. Even when data is adjusted using log transformations, the correlation with the hyperinsulinemic-euglycemic clamp test (the gold standard for measuring insulin sensitivity) remains moderate at best.
Population differences further muddy the waters. Factors like body mass index (BMI), age, and ethnicity can all affect test results. For example, a fasting insulin level of 10 μIU/mL might signal clear insulin resistance in one lab (using a cutoff of >10 μIU/mL) but be considered borderline in another lab that uses a >12 μIU/mL threshold. Similarly, a HOMA-IR value of 1.8 might be deemed "healthy" under one guideline (<1.9) but interpreted as "suggestive of resistance" under another (>1.5). These inconsistencies make it difficult for clinicians to make confident decisions, especially when deciding whether to start treatment. Clearly, there’s a need for more standardized and reliable testing methods.
Research Gaps and Future Directions
To address these challenges, researchers are exploring ways to refine diagnostic tools and improve test reliability. This is especially important for early detection and tailoring treatments to individual needs. Right now, most insulin resistance tests rely on fasting measurements, which don’t capture the dynamic interplay between glucose and insulin. While the hyperinsulinemic-euglycemic clamp test offers unmatched precision, its complexity and time requirements make it impractical for routine screening.
Scientists are actively working to close this gap. One promising approach involves using tracer-labeled oral glucose tolerance tests to provide more accurate data for large-scale populations. Combining multiple markers - such as fasting insulin, triglycerides, and BMI - has also shown potential. For example, combining these markers increases test sensitivity from 0.57 (when using fasting insulin alone) to 0.64. Another advancement is the CardioIQ IR score, which categorizes insulin resistance risk levels: scores under 33 indicate normal sensitivity, scores between 33 and 66 suggest a fourfold increase in resistance odds, and scores over 66 point to a 15-fold increase.
Looking ahead, efforts to standardize insulin assays across laboratories could help minimize inconsistencies. Researchers are also working on developing hepatic insulin resistance indices based on clamp studies, which could significantly improve diagnostic accuracy for millions of Americans. These advancements hold promise for making insulin resistance testing more reliable and accessible in the future.
Measuring Insulin Resistance
Conclusion
Understanding blood test results for insulin resistance involves looking at multiple markers together. For example, a fasting glucose of 98 mg/dL might seem fine on its own. But when combined with a fasting insulin level of 12 μIU/mL, a HOMA-IR of 2.8, and a TG:HDL ratio of 4.0, it clearly points to insulin resistance. Using a combination of markers - like fasting insulin, HOMA-IR, and triglyceride ratios - gives a much clearer picture than just focusing on glucose levels. This is especially important for women with PCOS.
For women with PCOS, where insulin resistance affects about 50–70%, monitoring multiple markers is critical for managing metabolic health and symptoms such as acne, hair loss, and unwanted facial hair.
However, interpreting these results isn’t always straightforward. Differences in lab methods, varying cutoff points, and the limitations of routine testing compared to advanced measures make professional guidance essential. Factors like BMI, family history, and PCOS status further emphasize the need for personalized interpretation.
Oana Health provides science-based telehealth services tailored to women managing insulin resistance and PCOS. Their offerings include customized prescription treatments, such as topical metformin, starting at $89/month, delivered right to your door.
"Oana's telehealth service is fantastic! It's helped manage my insulin levels and reduce excess hair growth I was experiencing due to PCOS. I'm recommending this to all my friends with PCOS."
If your blood tests reveal two or more abnormal markers - such as glucose above 95 mg/dL or fasting insulin over 8 μIU/mL - it's crucial to talk to your healthcare provider about combined testing and regular monitoring. Taking action early can lower your risk of developing diabetes by 58%. A thorough review of your bloodwork, using multiple markers together, is essential for timely and effective care.
FAQs
What can blood tests reveal about early signs of insulin resistance?
Blood tests play a crucial role in detecting insulin resistance early, even before any symptoms become apparent. Some key markers to look out for include:
- Elevated fasting insulin levels: This can indicate that your body is working overtime, producing extra insulin to counteract reduced sensitivity.
- High fasting blood glucose levels: A warning sign that your blood sugar regulation might not be functioning properly.
- Abnormal lipid profiles: This includes high triglyceride levels or low HDL cholesterol, both of which are often linked to insulin resistance.
These indicators can shed light on how your body is handling insulin and help guide timely steps to address potential issues before they escalate.
What do fasting insulin levels and HOMA-IR tell us about insulin resistance?
Fasting insulin levels and HOMA-IR are important markers when assessing insulin resistance. When fasting insulin levels exceed 25 mU/L, it often points to decreased sensitivity to insulin.
HOMA-IR, short for Homeostatic Model Assessment of Insulin Resistance, combines fasting insulin and blood glucose levels to provide a clearer picture of insulin resistance. A HOMA-IR score above 2.9 typically indicates insulin resistance. These measurements are valuable for understanding how effectively your body uses insulin and can play a critical role in managing conditions like PCOS or challenges with weight control.
Why is it essential to track multiple health markers in women with PCOS?
Tracking a variety of health markers is essential for understanding the overall well-being of women with PCOS. It provides insight into hormonal imbalances, insulin resistance, and metabolic health, all of which are closely linked in this condition. Regular monitoring allows healthcare providers to design personalized treatment plans aimed at managing symptoms such as irregular menstrual cycles, unwanted hair growth, and changes in weight.
By focusing on the specific needs of each individual, this method not only helps control symptoms but also supports better long-term health.